Sensemaking in Complex Multi-data Immersive Analytics Systems
Role: Graduate Research Assistant | Timeline: Nov 2023-Dec 2025
Team: Dr. Anita Komlodi, Dr. Priya Rajasagi (PI)
Overview
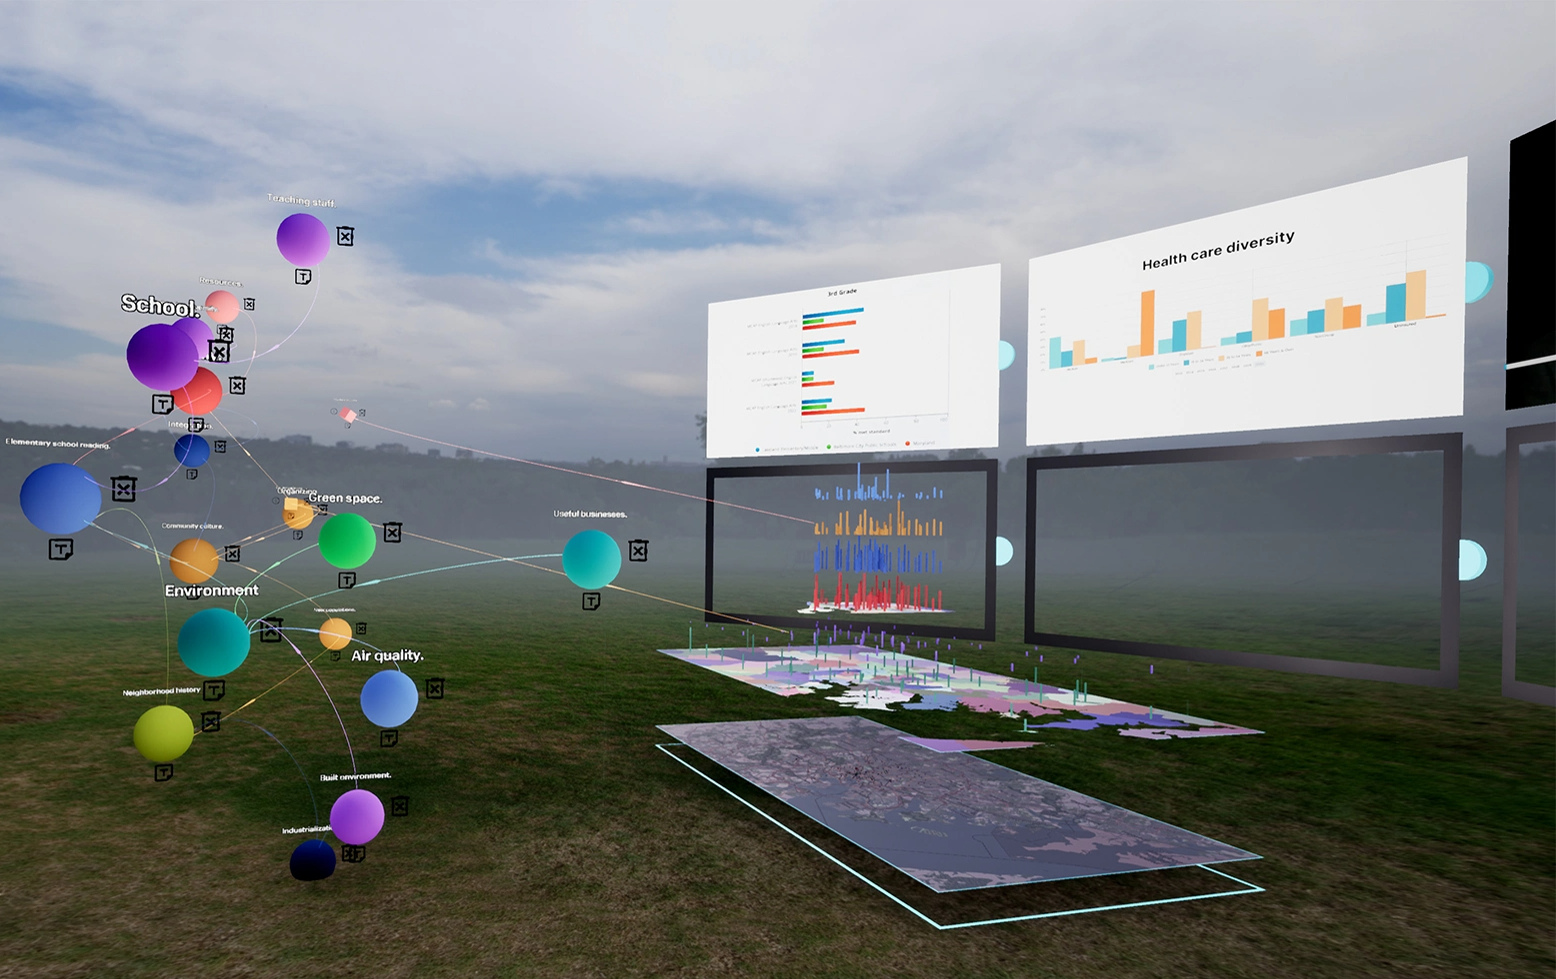
Our system, System Exploration and Engagement Environment (SEEe), is an immersive VR-based data visualization system designed to integrate qualitative and quantitative information in a shared space. By combining community narratives, news articles, and school performance data on a geographic map, SEEe enables users to explore complex, interconnected issues. This study investigates how immersive analytics systems like SEEe can support sensemaking and inquiry-based learning in education contexts.
Responsibilities
- Used a researcher-developed rubric to evaluate user strategies, grouping participants into high, medium, and low levels. Analyzed their sensemaking and inquiry-based learning patterns within each group and compared these patterns across categories.
- Conducted video analysis by transcribing participants’ behaviors during VR tasks to capture sensemaking processes.
- Performed User Experience Questionnaire (UEQ) analysis to assess participants’ perceptions of the SEEe immersive environment.
- Contributed to academic publications by synthesizing findings and co-authoring research papers.
Research Questions
R1: How do immersive multi-format data visualization systems support inquiry-based learning of complex systems?
R2: What sensemaking strategies do users adopt in immersive analytics environments?
Problem Statement
While immersive analytics systems like SEEe hold promise for supporting complex, inquiry-based learning, little is known about how users—especially future educators—interact with multi-modal data in VR environments. The lack of usability insights and cognitive load evaluation creates a barrier to effectively integrating such tools into educational contexts.
Participants
18 participants K-12 educators or students studying in education provides perspectives on how immersive analytics could inform real-world teaching and learning practices.
System Design
SEEe enables users to
- Build conceptual diagrams with bubble-shaped nodes.
- Add annotations through virtual sticky notes.
- Interact with multimodal datasets, including:
- Videos featuring community perspectives
- News articles on local education issues
- Quantitative school data mapped geographically across Maryland
This design allows users to visually and conceptually link diverse data sources to develop a holistic understanding of complex problems.
Methods
We designed a a three-session lab-based user study to understand how teachers engage with immersive VR data for learning and sensemaking. The study simulated a longer-term learning experience so participants could gradually explore complex, multimodal data and build connections over time.
Session 1 (Remote): Participants completed a short conceptual mapping activity and reflected on factors that influence elementary education. This helped capture their initial ideas before using VR.
Session 2 (Individual VR): Participants explored the SEEe immersive analytics system in VR after a guided tutorial. They examined multimodal data (videos, community narratives, and school performance metrics) and created their own conceptual diagrams. Afterward, they shared their experiences through short surveys and interviews.
Session 3 (Collaborative VR): Participants worked in pairs within SEEe, using the same immersive tools but with more time to collaborate and discuss relationships in the data.
This design allowed us to observe how participants' strategies and sensemaking evolved over time, both individually and collaboratively.
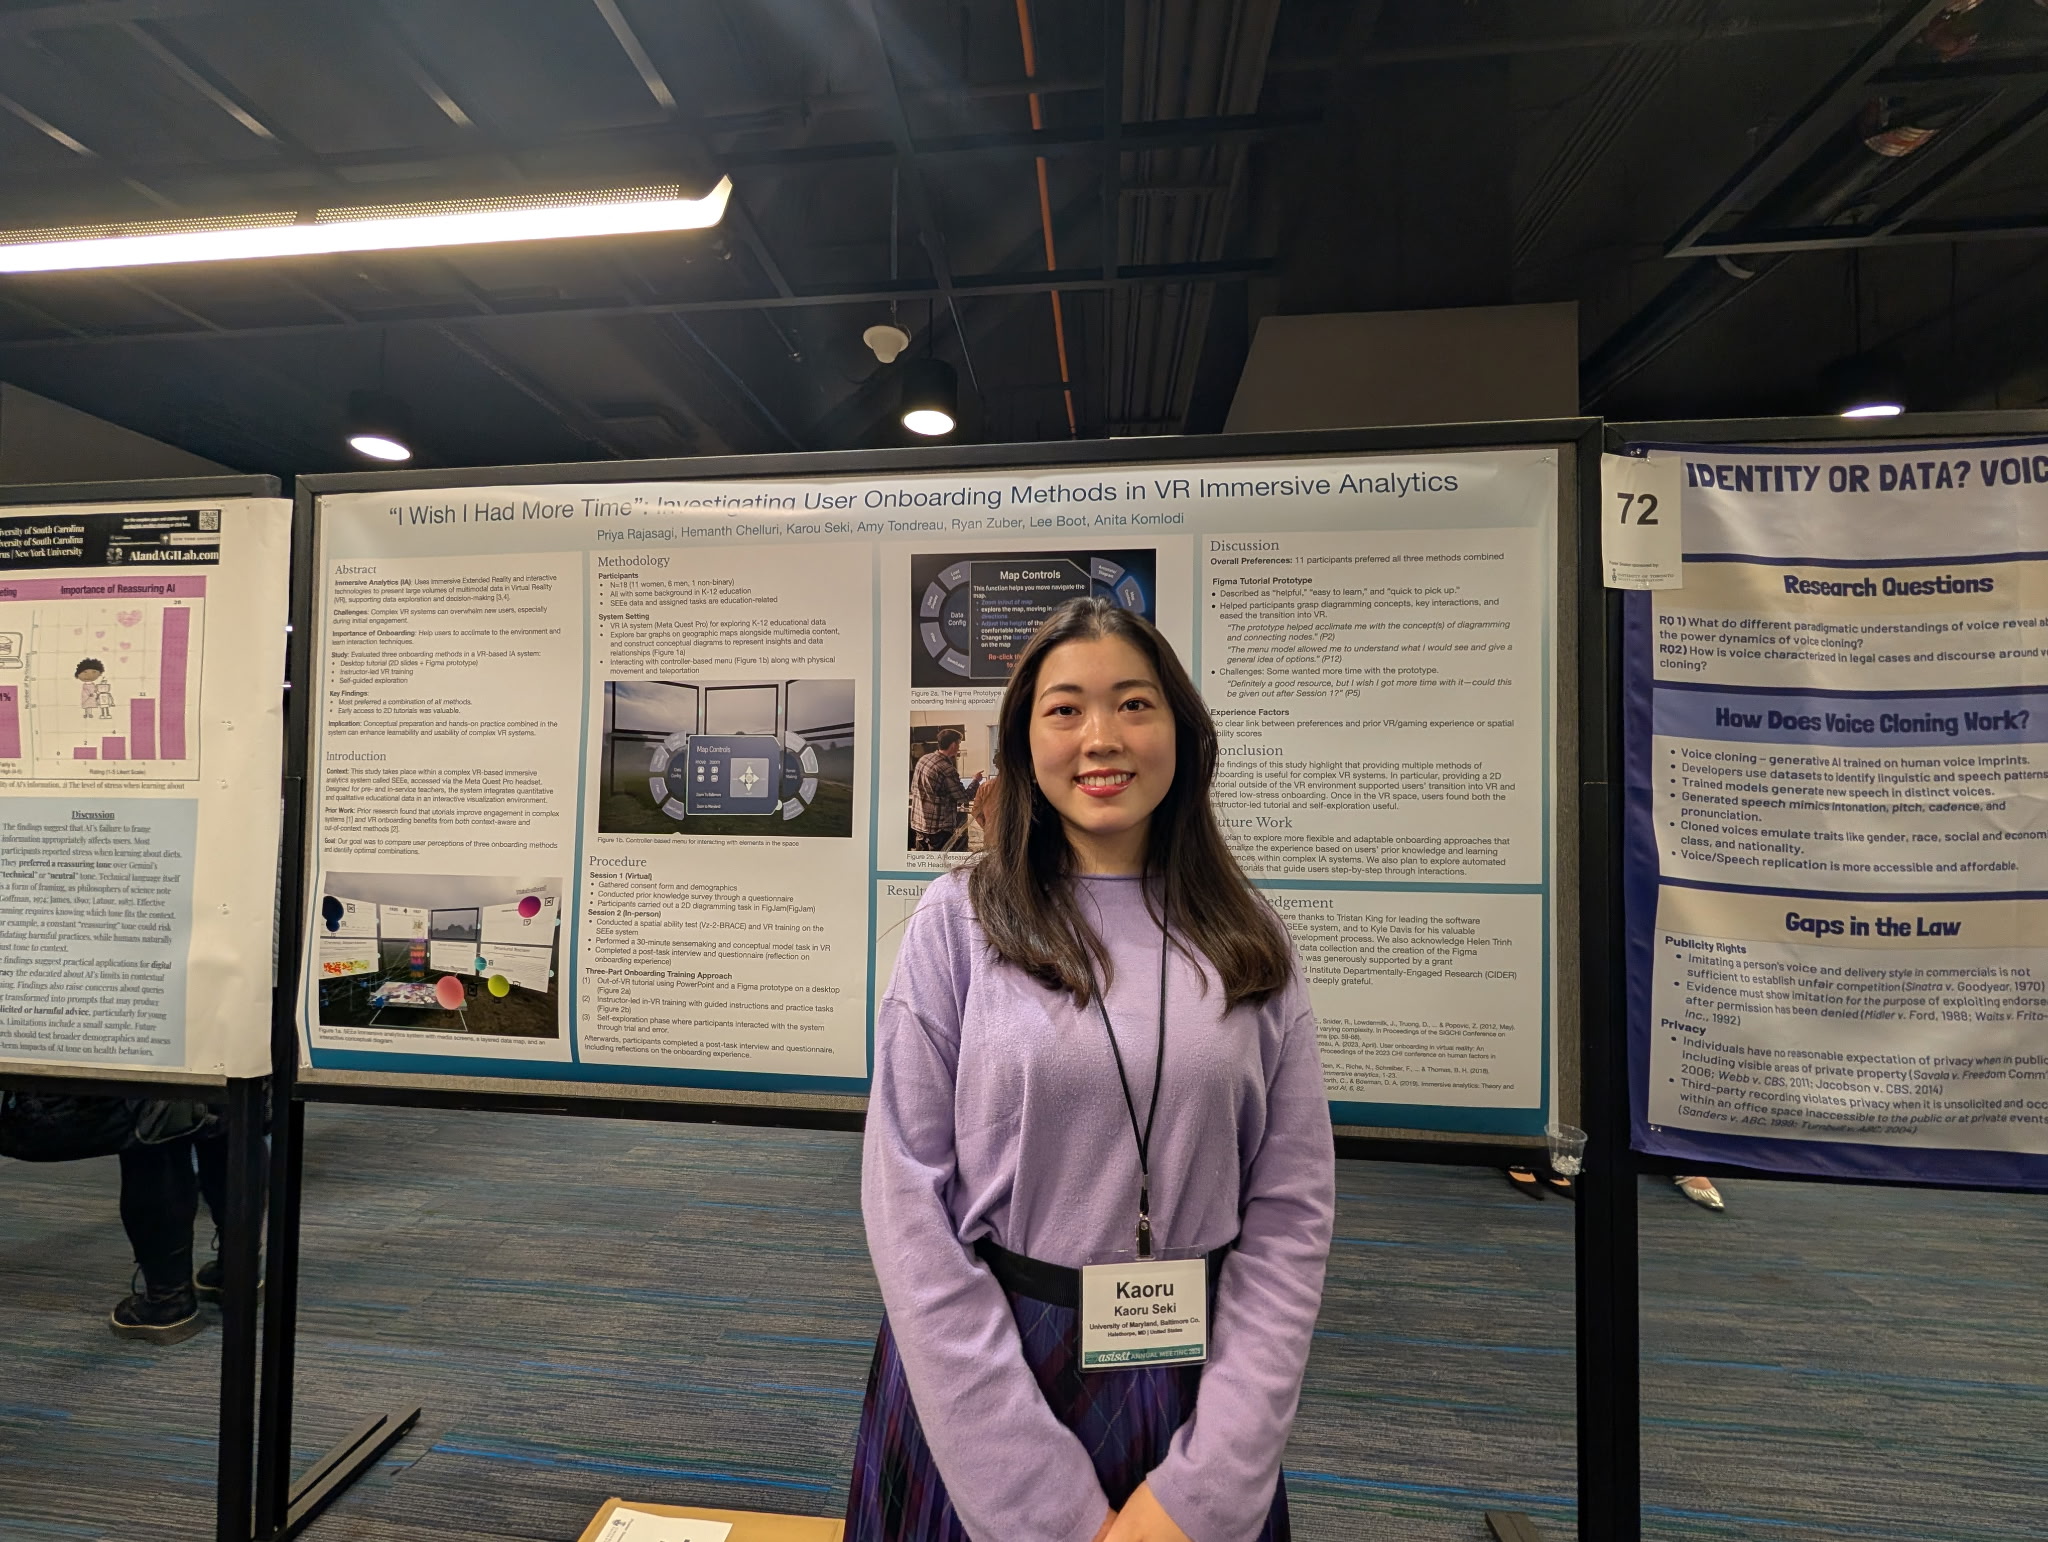
Piblications
Poster has been accepted at ASIS&T 2025 conference and highlights key usability dimensions for immersive analytics tools in onboarding.